Project Initiation
General System & Permissions
Release Notes
January 2026
May 2025
September 2024
June 2024
January 2024
December 2023
September 2023
August 2023
July 2023
June 2023
May 2023
Supplier Management How-To Guides
Supplier Admin & Information Management
Data Governance Dashboard
Supplier Creation
Onboarding Management Plans
Completing Activities
Assigning Classifications to a Supplier record
Issuing an External Assessment
Supplier Status
Supplier Onboarding Dashboard
Assigning Contacts & Stakeholders
Uploading Documents to a Supplier record
Suppliers Dashboard
Supplier Compliance Management
Assigning Insurances and Certifications
Insurances & Certifications Dashboard
Team Governance Dashboard
Assessment Summary Dashboard
Supplier Risk & Issue Management
Issuing a Risk Assessment
Risk Assessments Dashboard
Creating a Supplier Risk
Managing a Supplier Risk
Creating a Supplier Issue
Managing a Supplier Issue
Supplier Risk Management Dashboard
Supplier Relationship & Performance Management
Contract Management How-To Guides
Contract Admin & Information Management
Contract Creation
Assigning Classification(s) against a Contract record
Contract Health Drivers & Checklist Completion
Contract Setup Dashboard
Uploading Documents to a Contract record
Contracts Dashboard
Foreign Currency
Contract Milestone & Key Date Management
Contract Renewals Management
Sourcing Management How-To Guides
Creation and Planning
Sourcing Activity Creation
Planning Tab
If you are Planning with Quick Quotes
If you are Planning with Opportunities Hub
Completing the Planning Phase
At Market
If you are At Market with an external tool
If you are At Market with Quick Quotes
If you are At Market with Opportunities Hub
Completing the At Market Phase
Evaluation
Outcome
Procurement Act 2023
Procurement Act Introduction and Navigation
Transforming Public Procurement
Source- to-Contract and the Procurement Act
Source-to-Contract Procurement Act Prerequisites
Navigating Procurement Act Features Within Source-to-Contract
Overview of Procurement Act Notices
Procurement Act Deep Dive
Bolt Ons
Additional Help
Knowledge Deep Dive
Process Templates (Contracts)
Process - For System Users
Contract Stage Progression Process
Requesting Stage Approval
Approving Stage Approval Requests
Variation Process
Requesting Variation Approval
Approving Variation Approval Requests
Contract Process Comparison
Configuration - For System Administrators
Supplier Categories
Management Plans
Artefact Groups
Activities
Triggers and Schedules
Supplier Data Requests
Delegation of Authority - Configuration
Delegation of Authority - Process
Terminology & Configuration Guides
Frequently Asked Questions
Where can I find information on the Procurement Act features?
Why can't I apply a variation against my contract?
How do I filter within Analytics?
I cannot access certain areas of the system, why?
How do I switch email alerts on?
How do I 'Finalise' my contract?
How long does it take for Analytics to update?
What file types can I upload?
The OneAdvanced Customer Support Portal
Admin: How can I assign a User the 'Contract Manager' role on the Customer Support Portal?
How to raise a Support case?
Admin: How can I remove a User from the Customer Support Portal?
Customer Portal Guide
Admin: How can I grant Admin permissions to a User on the Customer Support Portal?
Admin: How can I find my organisation's Registration Code?
How do I access the OneAdvanced Customer Support Portal?
Admin: How do I approve a new User on the Customer Support Portal?
How can I raise a finance case with OneAdvanced?
- All categories
- General System & Permissions
- Analytics Navigation
- How to use Visuals
How to use Visuals

How to use Visuals
Focus Mode
Focus mode enables the user to home in on one particular visual or table and temporarily make that the sole item shown in the dashboard.
To activate focus mode, hover the cursor over your chosen visual or table and select the following icon that will appear at the top of the visual/table:

This icon will typically appear above the top right corner of the visual selected (although can appear below the bottom right corner on certain visuals/tables).
Once the focus mode icon has been selected, the view will change to show the chosen visual in full screen and temporarily hide all other information on the page.

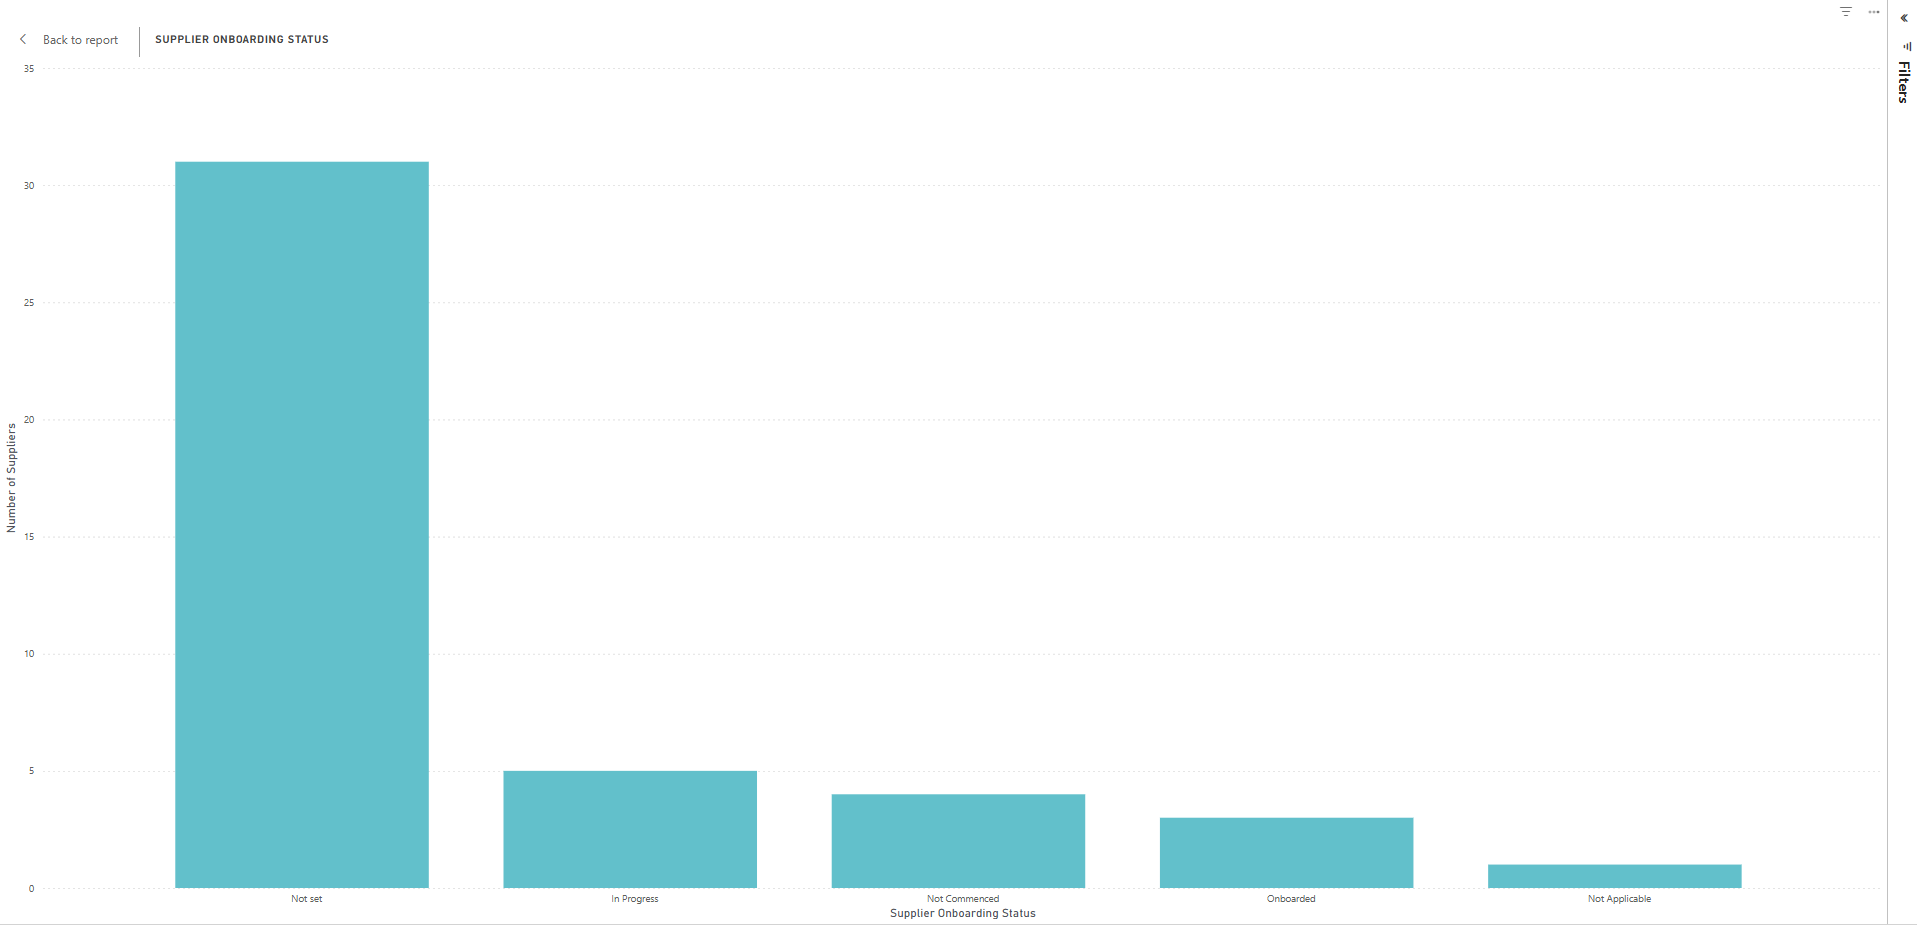
To return to the original dashboard view, select the “Back to report” button.
Exporting Data
You can export data in a table format from the dashboards into a Microsoft Excel document if required. This functionality could be utilised for a key element of the Data Governance dashboard (this will be explained in the article specific to this dashboard).
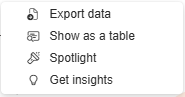
To export table data, select the table in the dashboard, select the ellipsis button that appears (usually above the top right or below the bottom right corner of the table):

and select Export data.
This will bring up a wizard for the options on how you want the data to be exported and it is from this wizard that you can click select and have this document added to your local Downloads folder.
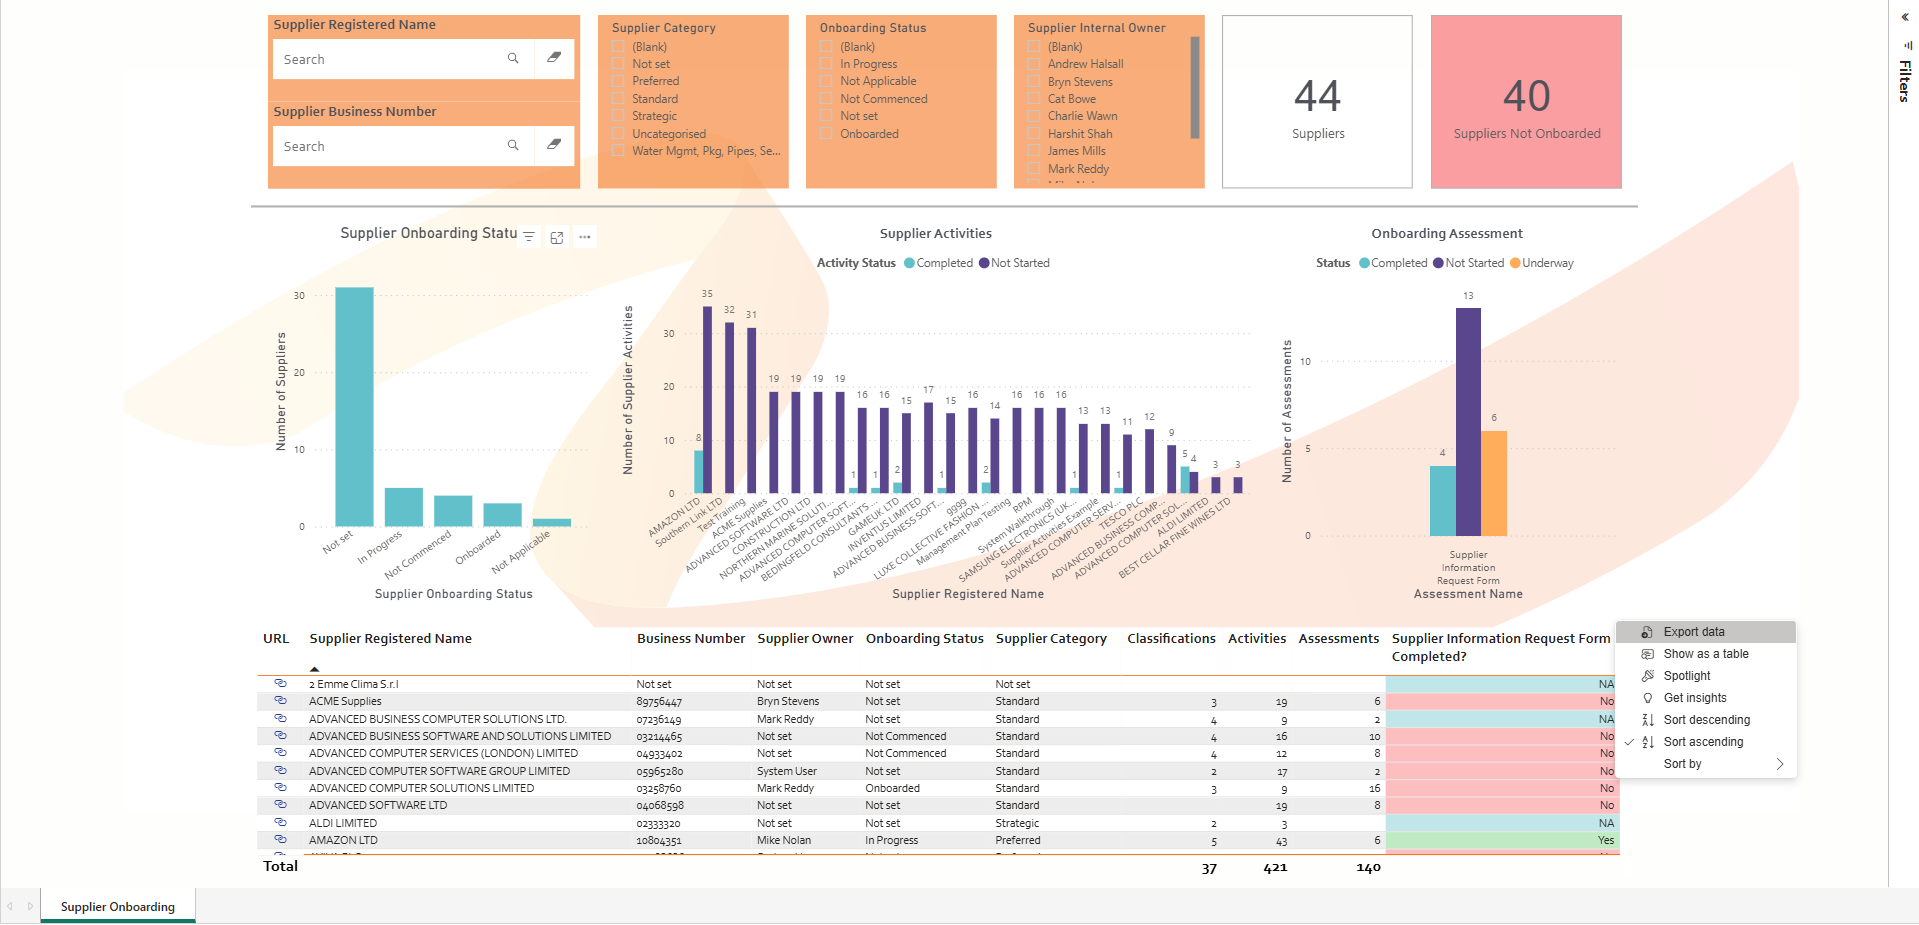
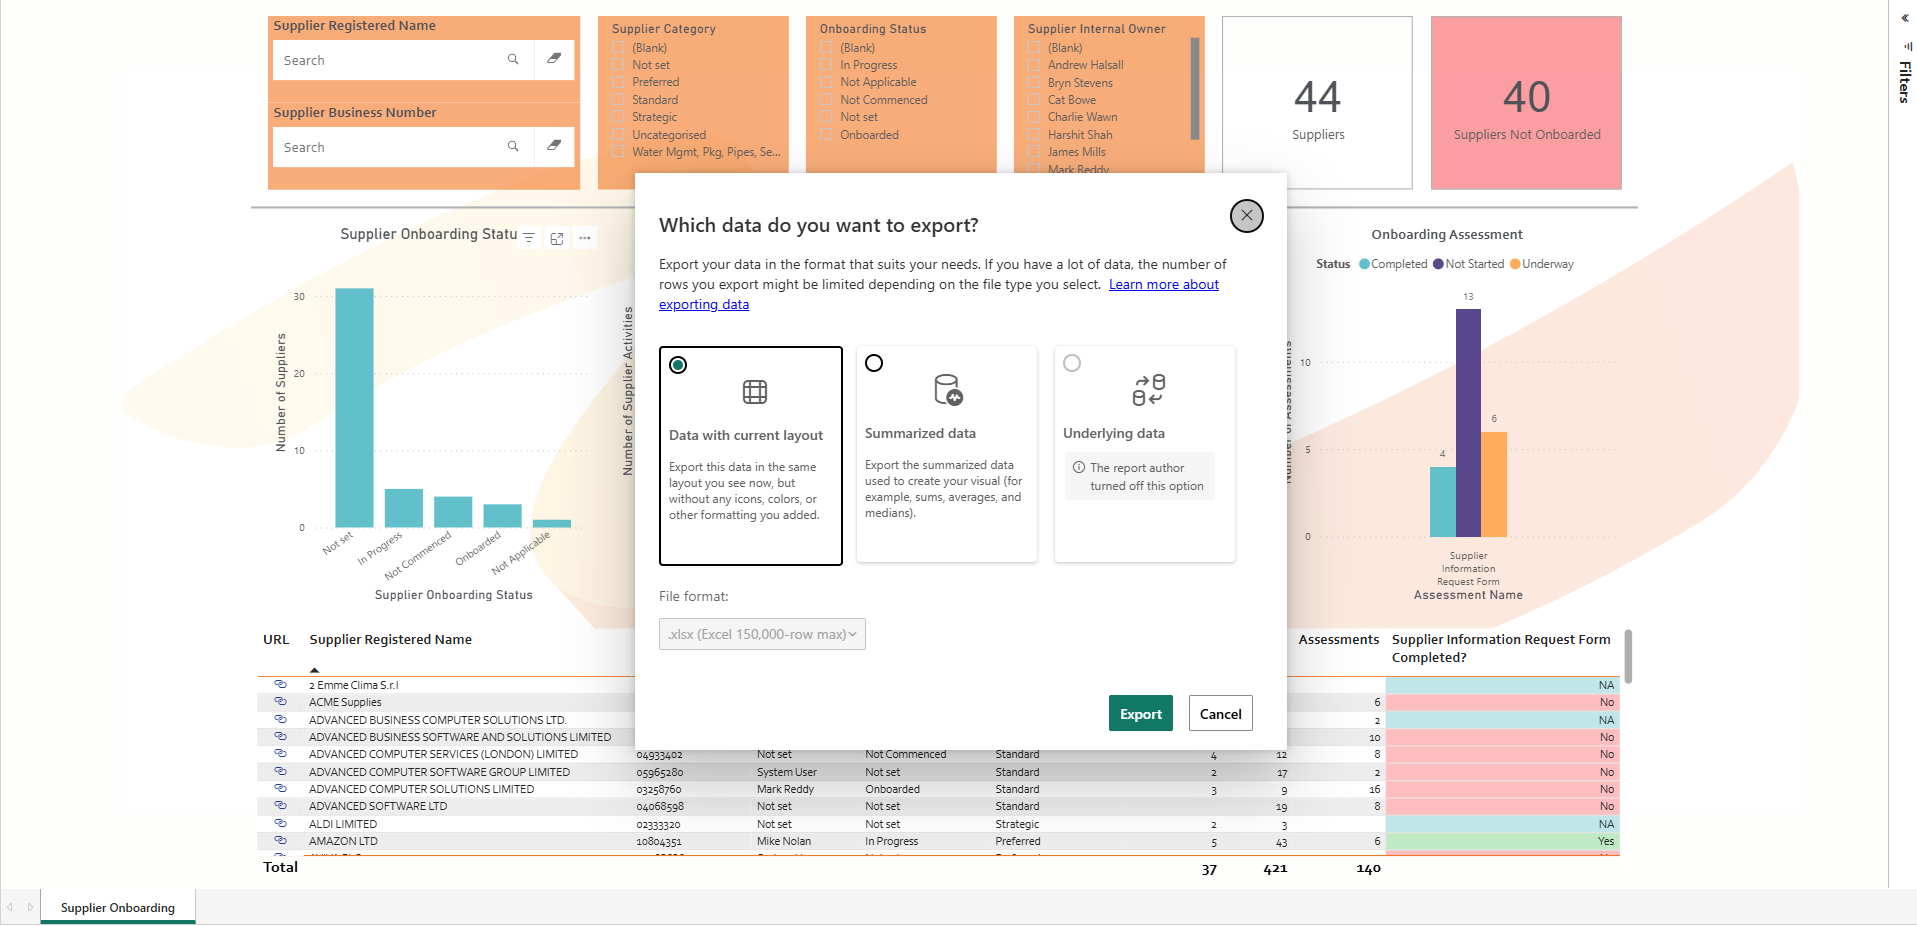
Table Format
In the scenario where a visual is unclear or if you would prefer it in a data format, there is functionality within the Analytics module to show visuals in a table format. To achieve this, select the ellipsis that appears when selecting or hovering over the visual and select Show as a table.
This will open the visualisation in Focus mode and then display the corresponding table of data represented in the visual below.

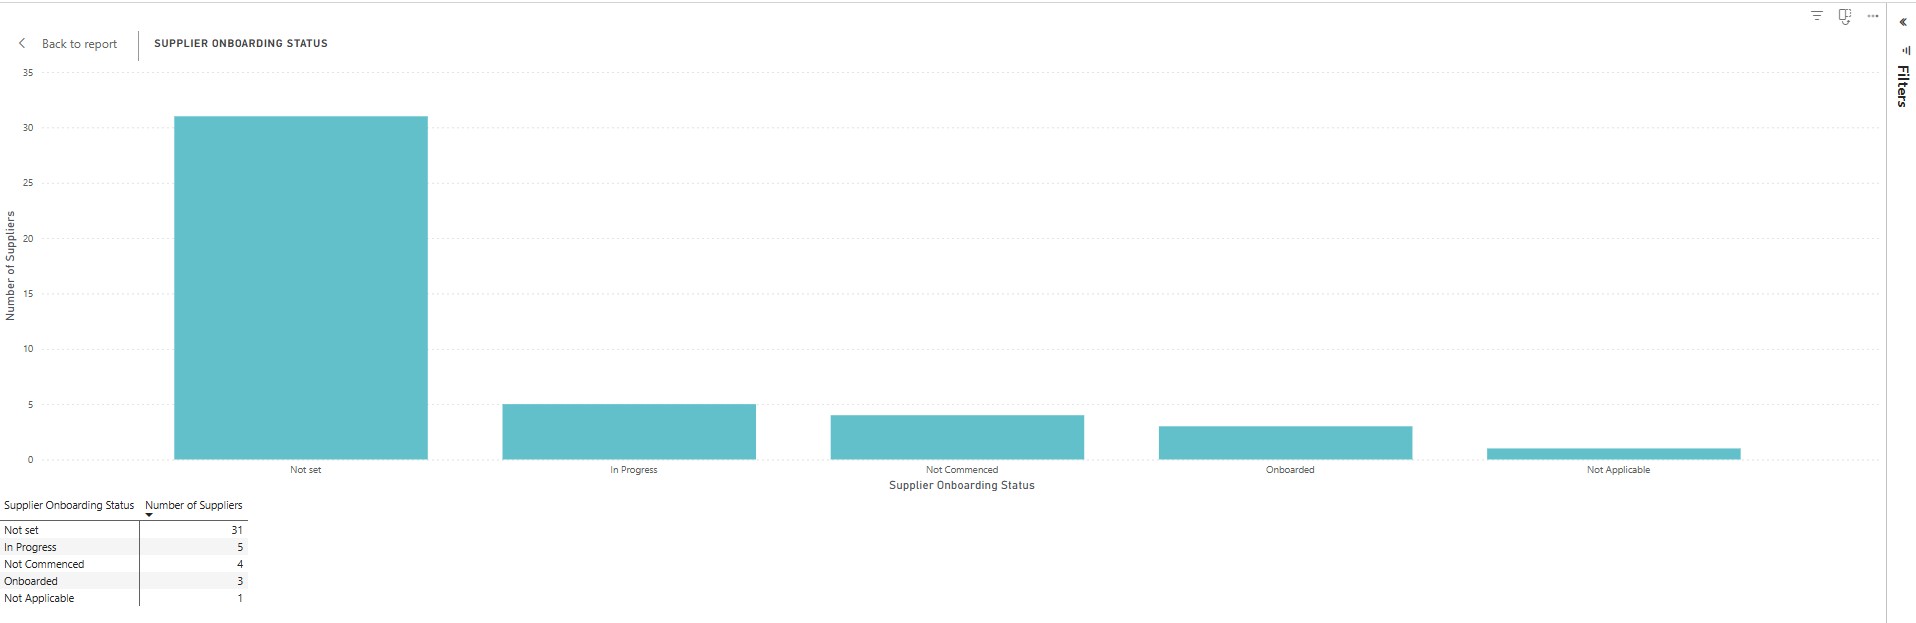
To return to the original dashboard view, select the “Back to report” button.

Spotlight
Spotlight is a similar function to Focus mode but operates in a different way to provide a different result. To Spotlight a visual, select the ellipsis that appears after hovering over or selecting it and then select Spotlight from that dropdown list.
Where Focus mode makes the visual full screen and removes sight of all other data on the dashboard page, Spotlight fades out the other visuals on the screen, so they are still slightly visible but are more transparent.
This leaves the visual in question the sole focus of the page while it remains in its usual size and location (Not full screen). This could be a useful tool when presenting this data in the scenario you want to draw attention to a specific variable in a configured set of circumstances and filters.

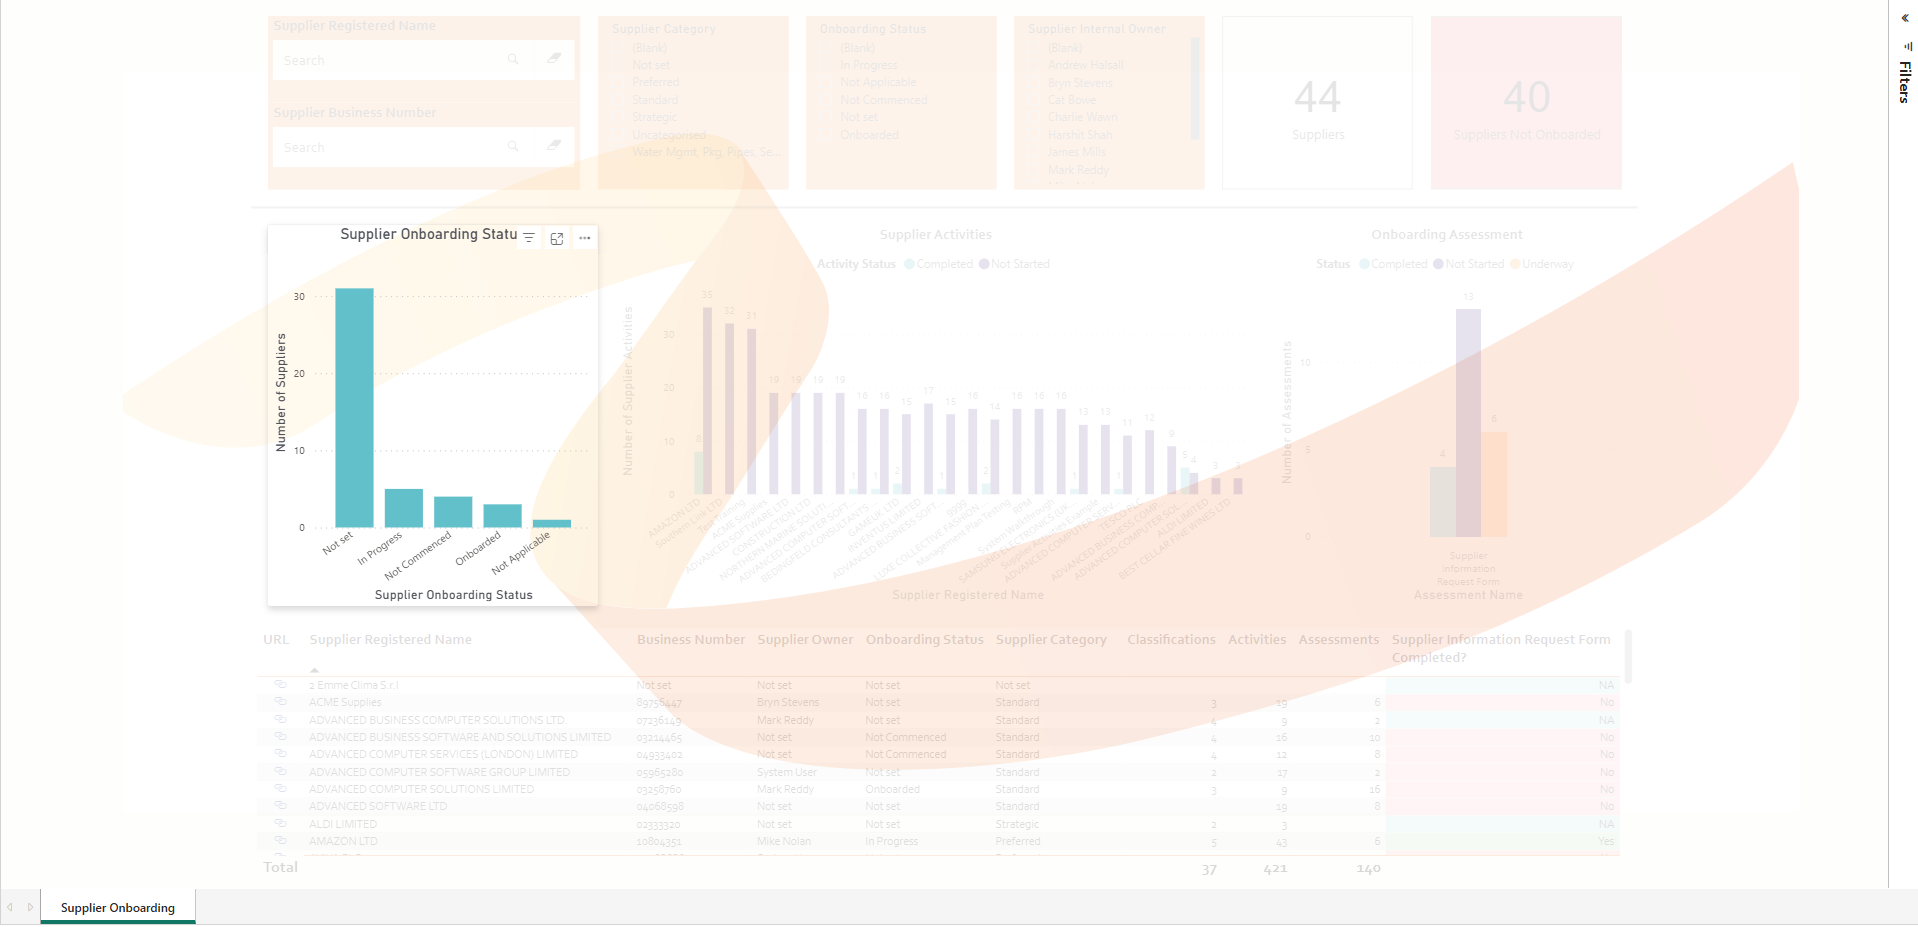
To return to the full dashboard view, click away from the highlighted visual in the dashboard.