Analytics Navigation

The Analytics module within your system includes a number of preconfigured dashboards that have been designed to utilise the configuration that is shipped with your site. There are designated articles throughout these HelpDocs to walk you through each of the specific dashboards. This article will walk you through how to use the Analytics module and the features available that will allow you to get the most useful reports and insightful data out of it.
Available Dashboards
When navigating to the Analytics module of the system, you will be presented with a list of pre-configured dashboard's that will link back to your system. Each dashboard will serve a different purpose and provide a different overview that should be clear from the dashboard's name. To provide a brief summary, there is:
- 00 Data Governance - to provide insight into the completeness of your data as well as a mechanism to update it
- 01 Supplier Onboarding - to provide insight into the progress of your onboarding activities across your supplier records
- 02 Insurances & Certifications - to provide insight into the responses to the Insurances & Certifications Information Request Form as well as the Insurances and Certifications held against the record
- 03 Supplier Risk Management - to provide insight into the responses to supplier risk assessments as well as overviews for the risks and issues assigned to your suppliers
- 04 Supplier Milestones - to provide insight into upcoming and overdue milestones assigned to your supplier records
- 05 Suppliers - to provide an overview of key information held across your supplier base
- 06 Supplier Performance Management - to provide insight into how well your suppliers are performing based on answers to the performance review assessments in the system
- 07 Supplier Scorecard - to provide a complete overview of a single supplier
- 08 Contract Setup - to provide insight onto the progress of your setup activities across your contract records
- 09 Contract Milestones - to provide insight into upcoming and overdue milestones assigned to your contract records
- 10 Contract Renewals Management - to provide insight into the options available regarding contract renewals and financial benefits included in your contract records as well as the end dates associated with your contract records
- 11 Contracts - to provide an overview of key information held across your contract base
- 12 Team Governance - to provide insight into the number of outstanding actions assigned to supplier and contract owners
- 13 Team and User Management - to provide insight into the teams in the system as well as the roles that users hold within those teams
When you select the dashboard you wish to view, there will likely be different tabs along the bottom of the dashboard page with slightly different areas of focus, combining to provide insight into the topic aligned with the overall dashboard's title.
Filters
On the right hand side of the page you will see the filter pane. This can be opened or minimised and allows you to filter the data being reported on within the dashboard. The filters are broken down into fields from the system allowing you to filter by specific data, such as suppliers with a specific Supplier Type (For example).
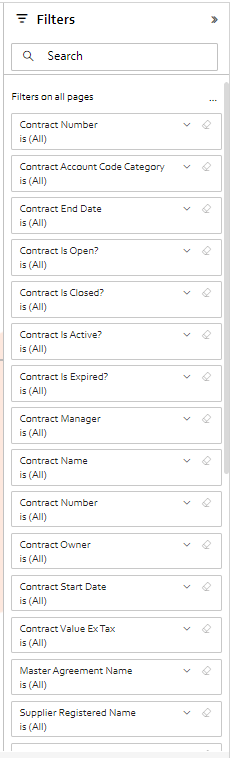
Within the dashboards themselves, there have been filters added that are designed to be the most relevant for the page that you are viewing. For example, in the Contract Renewals Management tab, there are filters for Options/Rights of Renewal Classification and Days until contract expiry.
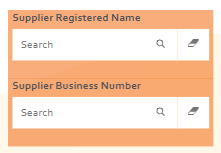
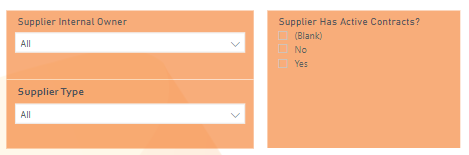
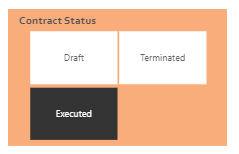
The filters within the dashboards will take four primary forms: typed, dropdown, tick box and tiles.
The typed option is primarily used to filter by a specific Supplier or Contract to provide the overview of the information shown on the dashboard for that supplier, instead of having to extract all that information by reading through the supplier record.
The dropdown and tick box filters work in a similar fashion and allow you to select multiple options to enable filtering with a filter A or filter B scenario.
The tile filter is typically used in scenarios where there are few options to select and it would be beneficial to have a clearer view of the options available and which filter specifically is being assigned. Unlike the two previous filters, this can only have one field selected at a time.
There is another method of filtering that you can utilise within these dashboards that does not require the filter pane or a specific filter on the page. By selecting data in any visual within the dashboards, there is the capability to filter by the portion of data selected.
For example, you can see in the image below that the dashboard is reporting to have data for 13 suppliers that hold insurance.
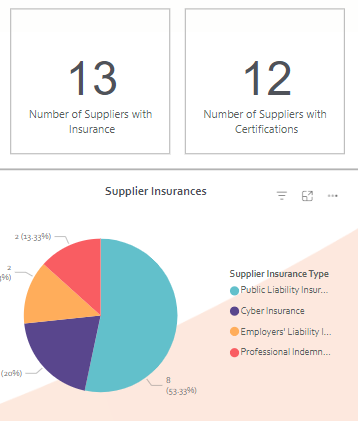
If you select the segment of the pie chart below to specific a particular type of insurance (In this case, Public Liability Insurance), the graphics and page around that visual will update to be filtered by that type of insurance also.
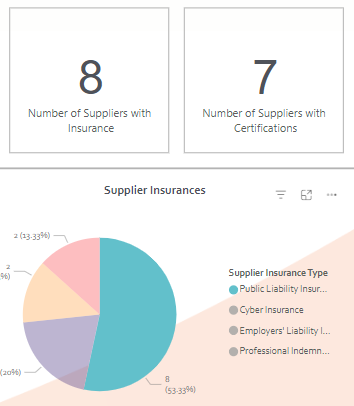
Selecting the same segment again will reset the filters.
Focus Mode
Focus mode enables the user to hone in on one particular visual or table and make that the sole item shown in the dashboard. This will open a view that makes the visual selected full screen and, as a result, means all the other information on the page is hidden.
To activate focus mode, select the visual you wish to focus on and select the following icon:

This icon will typically appear above the top right corner of the visual selected (But can also appear below the bottom right corner). This then allows a larger view of the visual in question and removes sight of any other information.
Exporting Tables
You can export data in a table format from the dashboards into a Microsoft Excel document if required. This functionality could be utilised for a key element of the Data Governance dashboard (This will be explained in the article specific to this dashboard).
To export table data, select the table in the dashboard, select the ellipsis button that appears (Usually above the top right or below the bottom right corner of the table) and select Export data. This will bring up a wizard for the options on how you want the data to be exported and it is from this wizard that you can click select and have this document added to your local Downloads folder.
Table Format
In the scenario where a visual is unclear or if you would prefer it in a data format, there is functionality within the Analytics module to show visuals in a table format. To achieve this, select the ellipsis that appears when selecting or hovering over the visual and select Show as a table.
This will open the visualisation in Focus mode and then display the corresponding table of data represented in the visual below.
Spotlight
Spotlight is a similar function to Focus mode but operates in a different way to provide a different result. To Spotlight a visual, select the ellipsis that appears after hovering over or selecting it and then select Spotlight from that dropdown list.
Where Focus mode makes the visual full screen and removes sight of all other data on the dashboard page, Spotlight fades out the other visuals on the screen so they are still slightly visible but are more transparent. This leaves the visual in question the sole focus of the page while it remains in its usual size and location (Not full screen). This could be a useful tool when presenting this data in the scenario you want to draw attention to a specific variable in a configured set of circumstances and filters.
Data Syncing
When creating or editing data, this data is not instantly reflected within the Analytics module. This typically takes 1 hour to update. This is not always exact so if data is needed in the Analytics module, please allow plenty of time to ensure this happens.
Assessment Dashboards
For data that is obtained from answers to assessment questions to load into the dashboards, the corresponding assessment needs to be marked as complete. It cannot be saved and incomplete.
However, if you wish for data to appear in a dashboard that you are going to update in the future (For example, to report on KPIs for the first 3 quarters so far), you can select the completed assessment in the system, add the necessary data to it and select save. This means the assessment is still complete but now contains more data and so this new data will be added to the dashboards
Tips
If you see a number tile within the system that shows its value as (Blank) instead of a number, this is because the system has no data to report. Therefore, where a tile says (Blank) this should be read as that tile having 0 value.
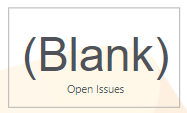
In the example above, there are 0 open issues within the system.